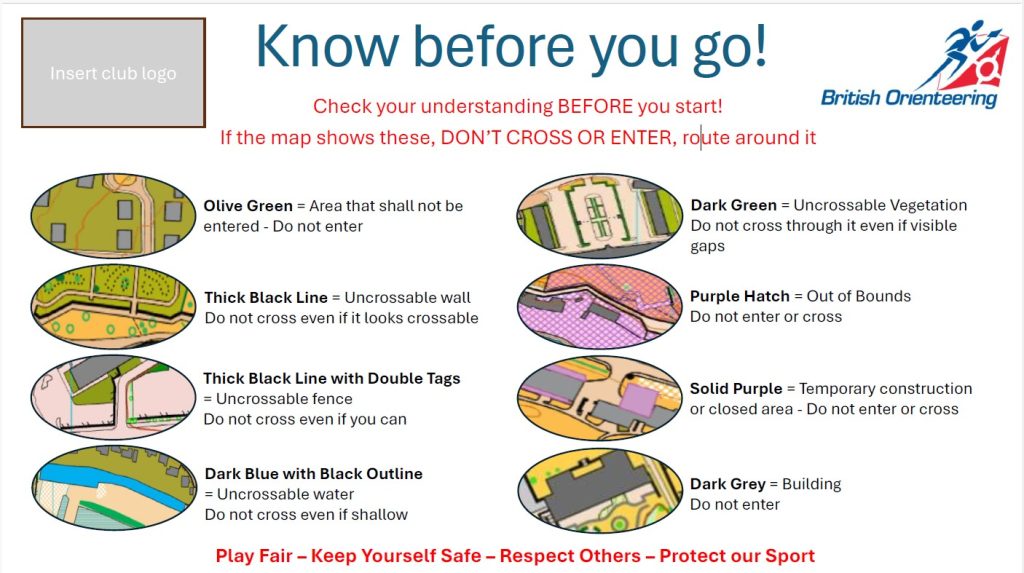
Orienteering Maps and Symbols
Orienteering maps are drawn using magnetic north rather than ‘grid’ or ‘true’ north, and are printed in up to five standard colours. The colours are an integral part of the map symbols:
- Black is used for most man-made features such as buildings and rock features such as cliffs, crags and boulders.
- Brown is used to show landform, including contour lines, gullies, pits and knolls (small hills).
- Blue is used for water features such as lakes, ponds, marshes and streams.
- White and green are used to depict the density of woodland and the extent to which it impedes progress. Open ‘runnable’ woodland is left white with progressively darker shades of green mean increased density.
- Yellow is used for unwooded areas with a solid yellow for grassy spaces such as playing fields and a paler yellow for rougher terrain (‘rough open’) such as heather.
Combinations of yellow and green show other types of terrain which will be explained in the legend.
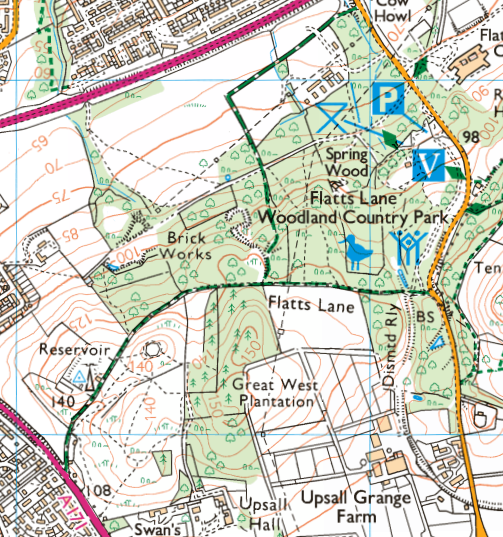
Here is an example of a map from Flatts Lane Woodland park near Normanby, Middlesbrough – an ideal. area to have your first orienteering adventure! Overprinted in purple are the checkpoints for one of our of Permanent Orienteering Courses.
Here is another map, this time from an urban setting around the university campuses at Stockton Riverside. On this map you can see a course from a major orienteering event that was due to happen in 2020.
Urban maps have some important different colour schemes and marking of features that are shown below:
If you are used to Ordnance Survey maps at 1:25,000 or 1:50,000 then the biggest differences you will find with orienteering maps are:
- Orienteering maps use white to represent runnable woodland and yellow to represent open areas (fields, parks, or moorland), whereas Ordnance Survey maps use green for any form of woodland and white for open areas.
- The scale of orienteering maps is much larger, often 1:10,000 for forests or 1:4,000 for urban areas. In the following table you can see what 1cm represents on the map at different scales. The larger scale allows much more detail to be shown, for example small paths, boulders, and ponds.
| Type of map | 1cm on the map represents… |
| 1:4,000 orienteering map of an urban area | 40m on the ground |
| 1:10,000 orienteering map of a forest | 100m on the ground |
| 1:25,000 Ordnance Survey map | 250m on the ground |
| 1:50,000 Ordnance Survey map | 500m on the ground |
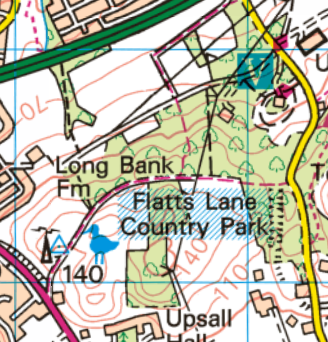
Below you can see the Ordnance Survey 1:25,000 and 1:50,000 maps of the same area as the Flatts Lane orienteering map above – see how much more detail there is on the orienteering map above!
To learn more about symbols used on an orienteering map, check out these downloadable guides to orienteering map symbols on the Maprunner website. However, if you are just starting out, don’t worry about needing to know every symbol – most maps are very intuitive.